Documentation
Welcome to the documentation for QuadWeather's radar viewer! The viewer loads and displays Level II radar data from the NEXRAD network of radars. Level II files contain radar data in its most complete form. Decoding the files typically requires desktop software, but this application packages that software for use in the browser. All you have to do is navigate to radar.quadweather.com.
Getting Started
When you arrive on the page, you will see a blank map, a top bar, and a side menu.
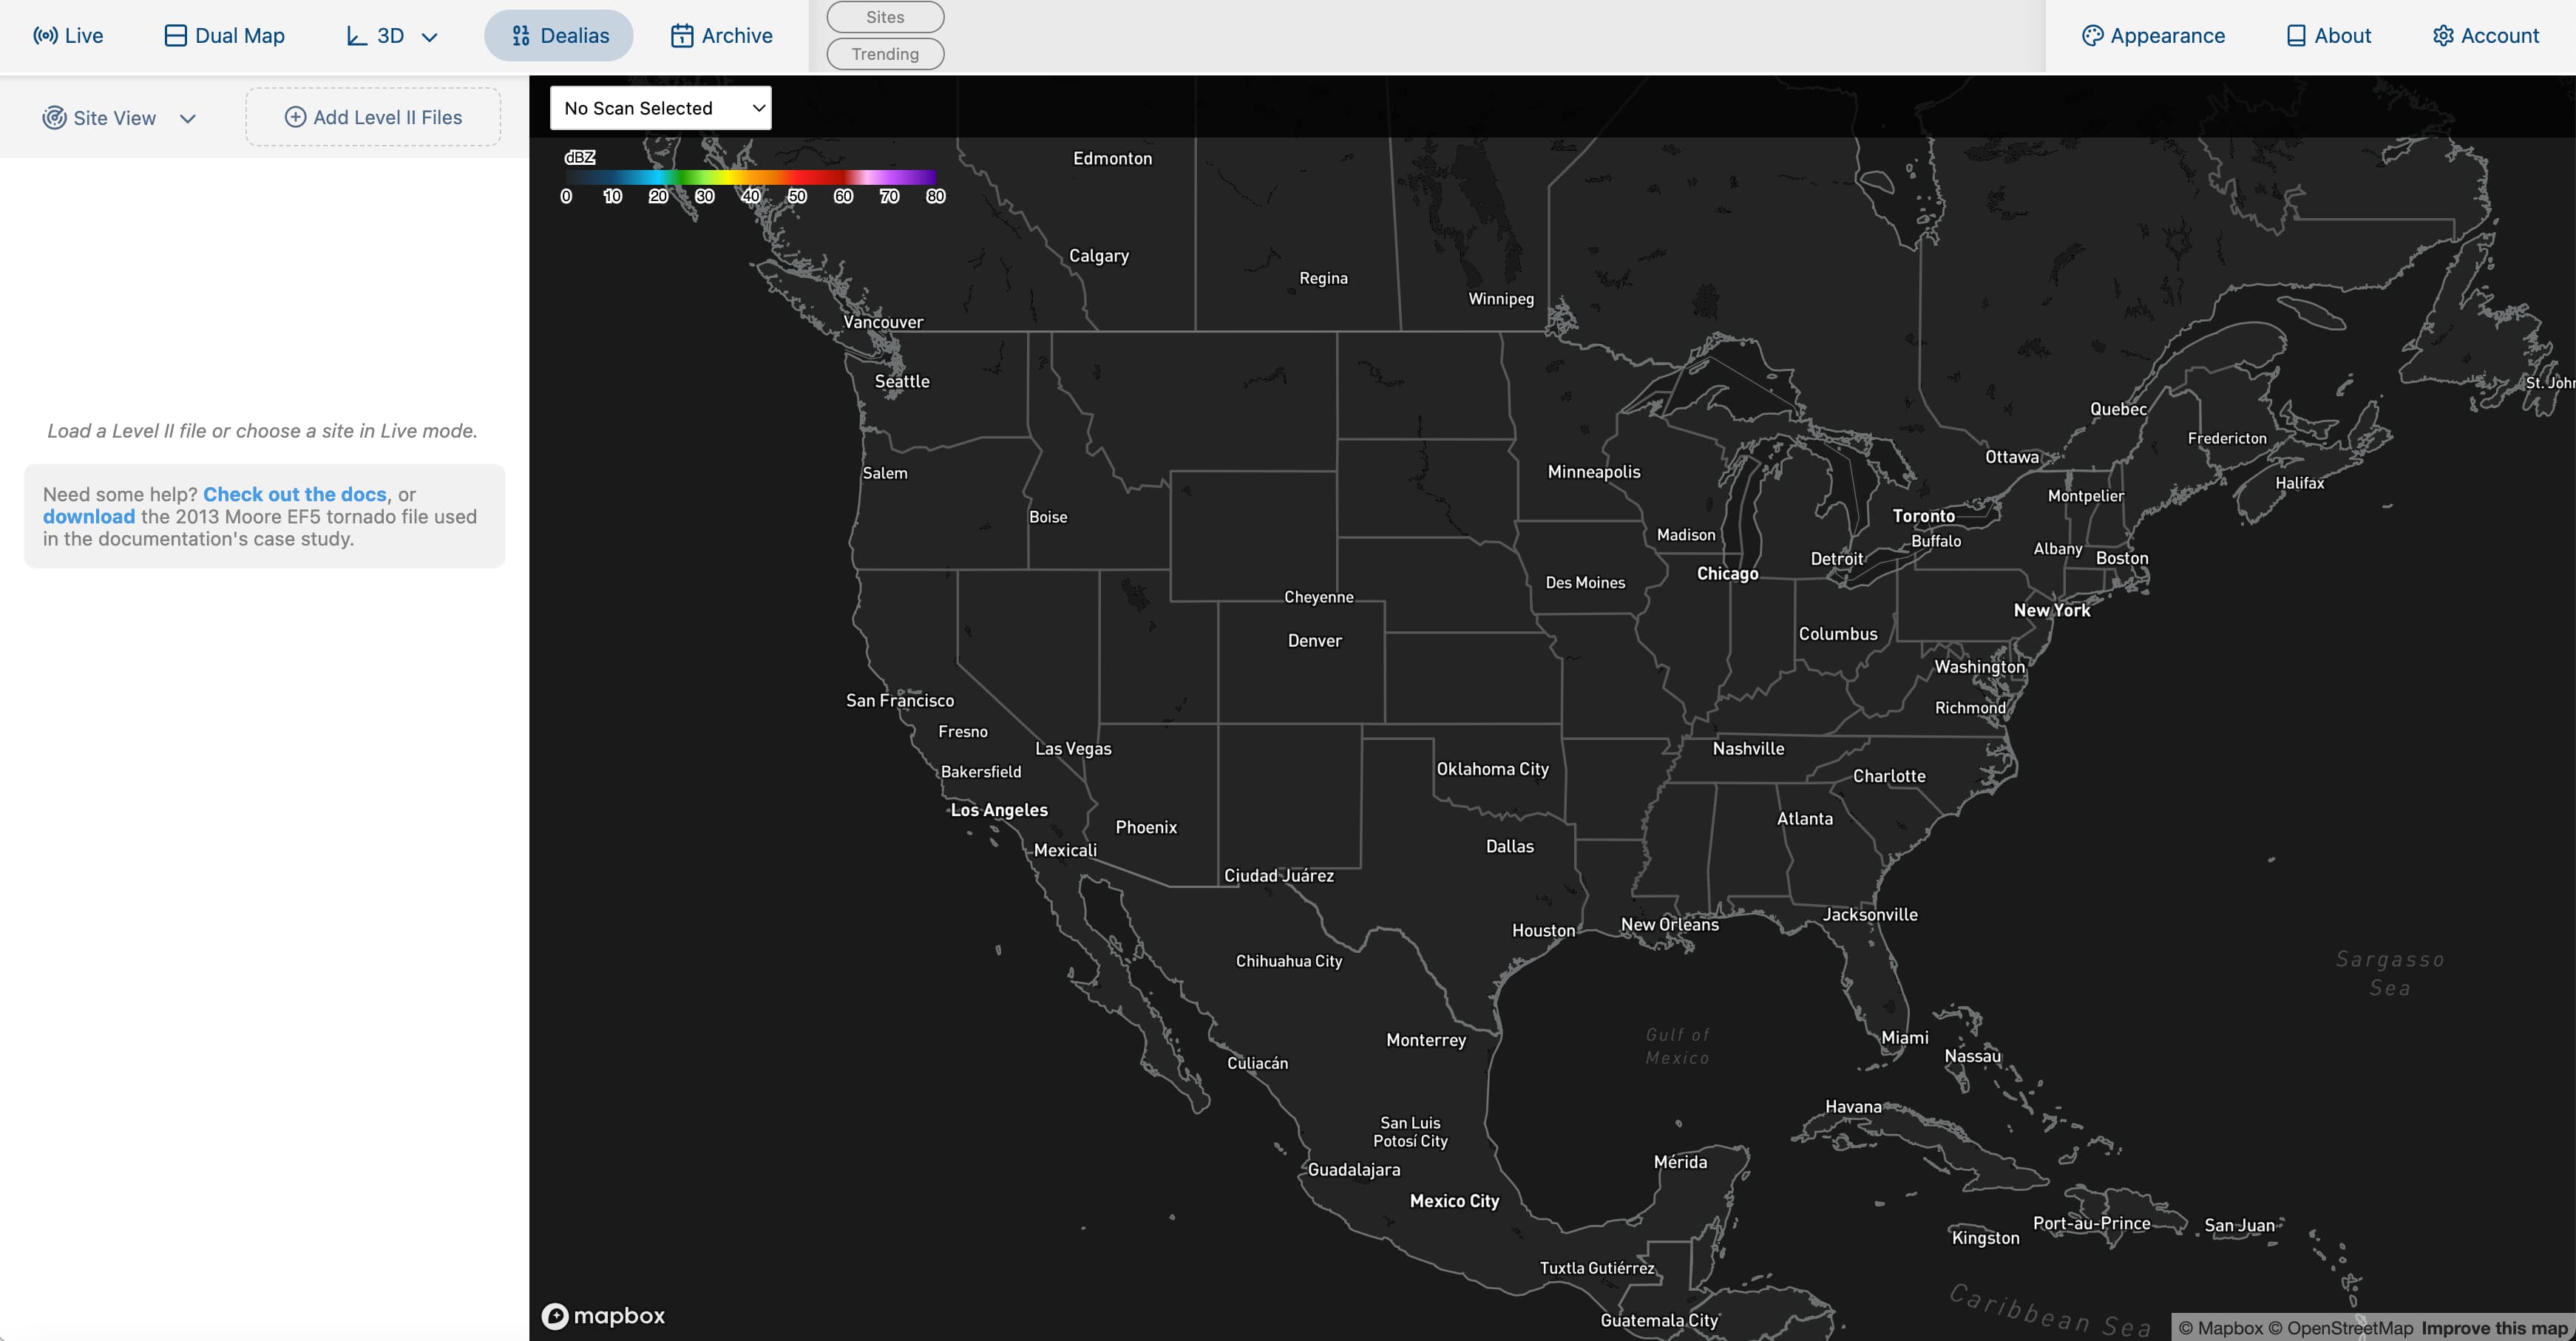
You have two options for loading radar data onto the map: add a Level II file from your computer, or click the button in the top bar to see the latest data collected from the network.
QuadWeather Extra subscribers have a third option: load a file from the built-in archive.
Case Study
Loading Data
This section walks through an example of loading a Level II file from your computer and inspecting the data. Browse your file system for the Level II file you want to view. This example uses a volume file from the KTLX radar on 20 May 2013 when an EF5 tornado was approaching Moore, Oklahoma. Clicking will open your file system for selection. You can also drag and drop a file or files into the dashed area as shown in the video below.
Viewing 3D
After dragging and dropping the file into the application, the map will zoom to the file's radar location. The first
field that displays is Reflectivity. A Level II file contains every elevation scanned by the radar,
which means the data can be pieced together to provide a 3D view. The video below shows entering
mode within the menu.
Once in Volume Render mode, click and drag a box over the area you want to view.
In this volume scan, the supercell's mesocyclone shows up clearly,
particularly because the storm is close to the radar and therefore well sampled.
Correcting Velocity
A powerful feature of the application is the ability to dealias the velocity data. Radar can only measure wind speeds within a certain range. If the speed exceeds that range, it wraps around to the other end of the scale. That wrapping is called aliasing, and it makes the velocity field impossible to interpret. In this EF5 example, you better believe the velocity values aliased. The video below shows loading the velocity field, which will automatically be dealiased as long as the button is active. Toggling Dealias mode shows the difference between a corrected and raw velocity field.
Note: Dealiasing is a computationally intensive process, so it can take up to 10 seconds to complete!
Dual Pane and Inspecting Data Values
Sometimes it is valuable to directly compare fields measured by the radar. Clicking the button will
open a side-by-side map view that allows direct comparison of multiple fields. In this example, Correlation Coefficient (CC) is compared to
velocity. Low CC values can indicate debris in the air.
Mousing over the map will log the corresponding data value in the top right of the view.
Mousing over one map will also produce a circle indicator on the second map at
the same location. Here, the debris signature is coincident with the velocity couplet, which indicates a radar-confirmed tornado.
View Modes and Deleting a File
There are two view modes in the application: and . Site View groups data from multiple files into the site they came from. This grouping allows you to choose an elevation level and easily step through different files. In File View, the data is grouped by file. At a glance, you can see all of the elevations in an individual file. Importantly, a file can only be removed from the application in the File View by clicking the trashcan icon next to its name. Due to the large size of Level II files and limited browser memory, the application can only load five at a time.
Live Mode
Live Data Layers
- SitesA map layer of the sites in the NEXRAD network. Click a site to load live data from it. Zoom in for TDWR sites.
- AlertsWarnings issued by the National Weather Service.
- StatementsWhite polygons designating storms below severe thresholds but deserving of a notice from the National Weather Service.
- LightningFlash points over the last 30 minutes from the Geostationary Lightning Mapper on GOES-19. Colored by age (gray old, white new).
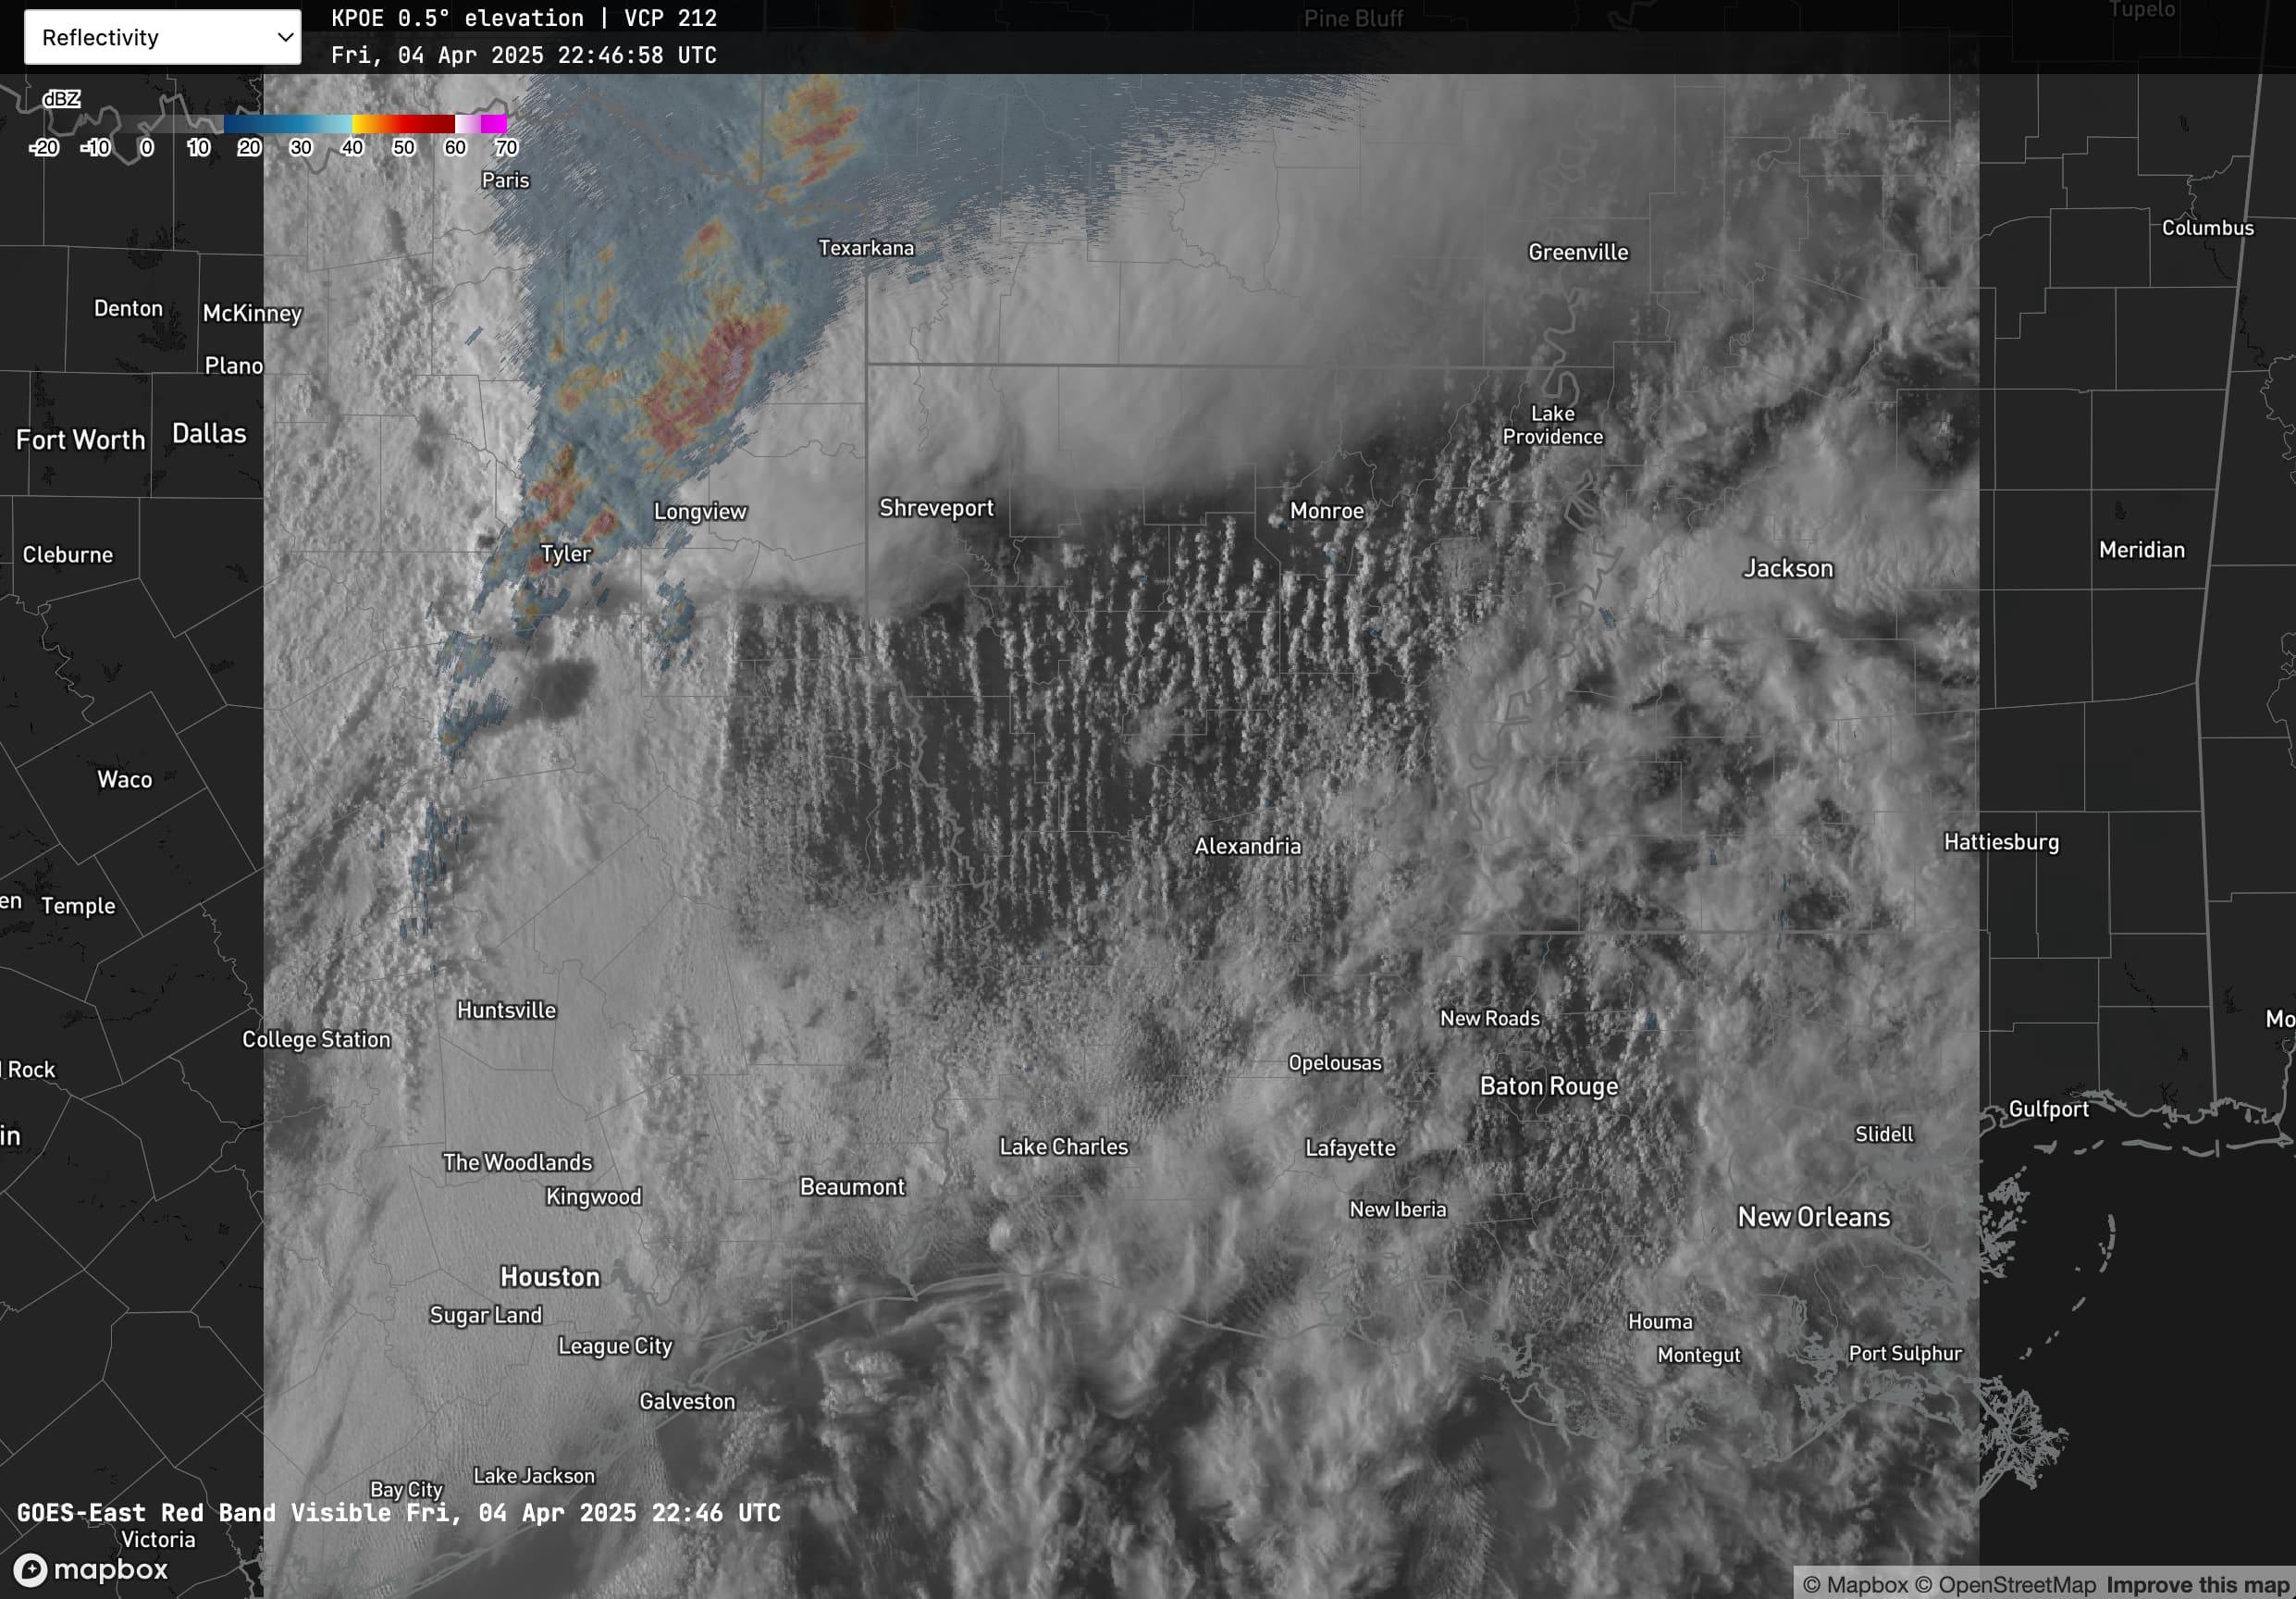
- Satellite
- MDsMesoscale Discussions issued by the Storm Prediction Center and Weather Prediction Center highlighting areas of expected severe storm or flooding development.
- National
- OutlookThe currently valid day-1 categorical and individual hazard Convective Outlooks issued by the Storm Prediction Center. Information on the changes to the outlooks that went into effect on 3 March 2026.
Visible satellite imagery from GOES-19 is available to QuadWeather Extra subscribers.
MRMS base reflectivity colored by HRRR precipitation type is available to QuadWeather Extra subscribers.

Data Update Cadence
The free version of the application loads complete volume files. That means it will wait until all elevation scans are complete. The scan most people are familiar with is the base scan, often 0.5-degree. It can be 5 minutes or more between the completion of the base scan and the rest of the elevations. In effect, the data will appear delayed. The notice below will keep you up to date on the progress of the next scan.
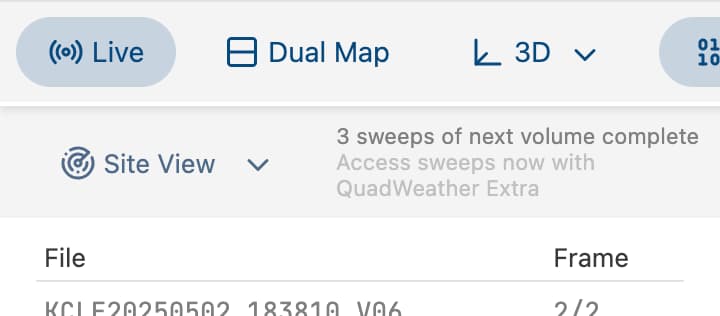
QuadWeather Extra subscribers will have access to each elevation as it completes. In other words, no delay.
Live 3D and Transfer Functions
Live 3D imagery can only be viewed by QuadWeather Extra subscribers.
When viewing data in a , it can be necessary to edit what's called the "transfer function". All a transfer function means is different levels of reflectivity will contribute different levels of transparency according to the values assigned to them. In the Joplin, Missouri example from May 2011 below, the middle levels of reflectivity are set to be transparent, which allows the high reflectivity associated with debris inside the tornado to be visible. Different transfer functions can highlight different atmospheric phenomena like hail or the eyewall of a hurricane. A few presets are available in the dropdown within the Volume Render settings window.
Derived Fields
The application can compute derived fields, meaning it can combine multiple elevation scans and datasets to produce fields that help in identifying severe updrafts and large hail. These fields are calculated on a 750-m resolution grid.
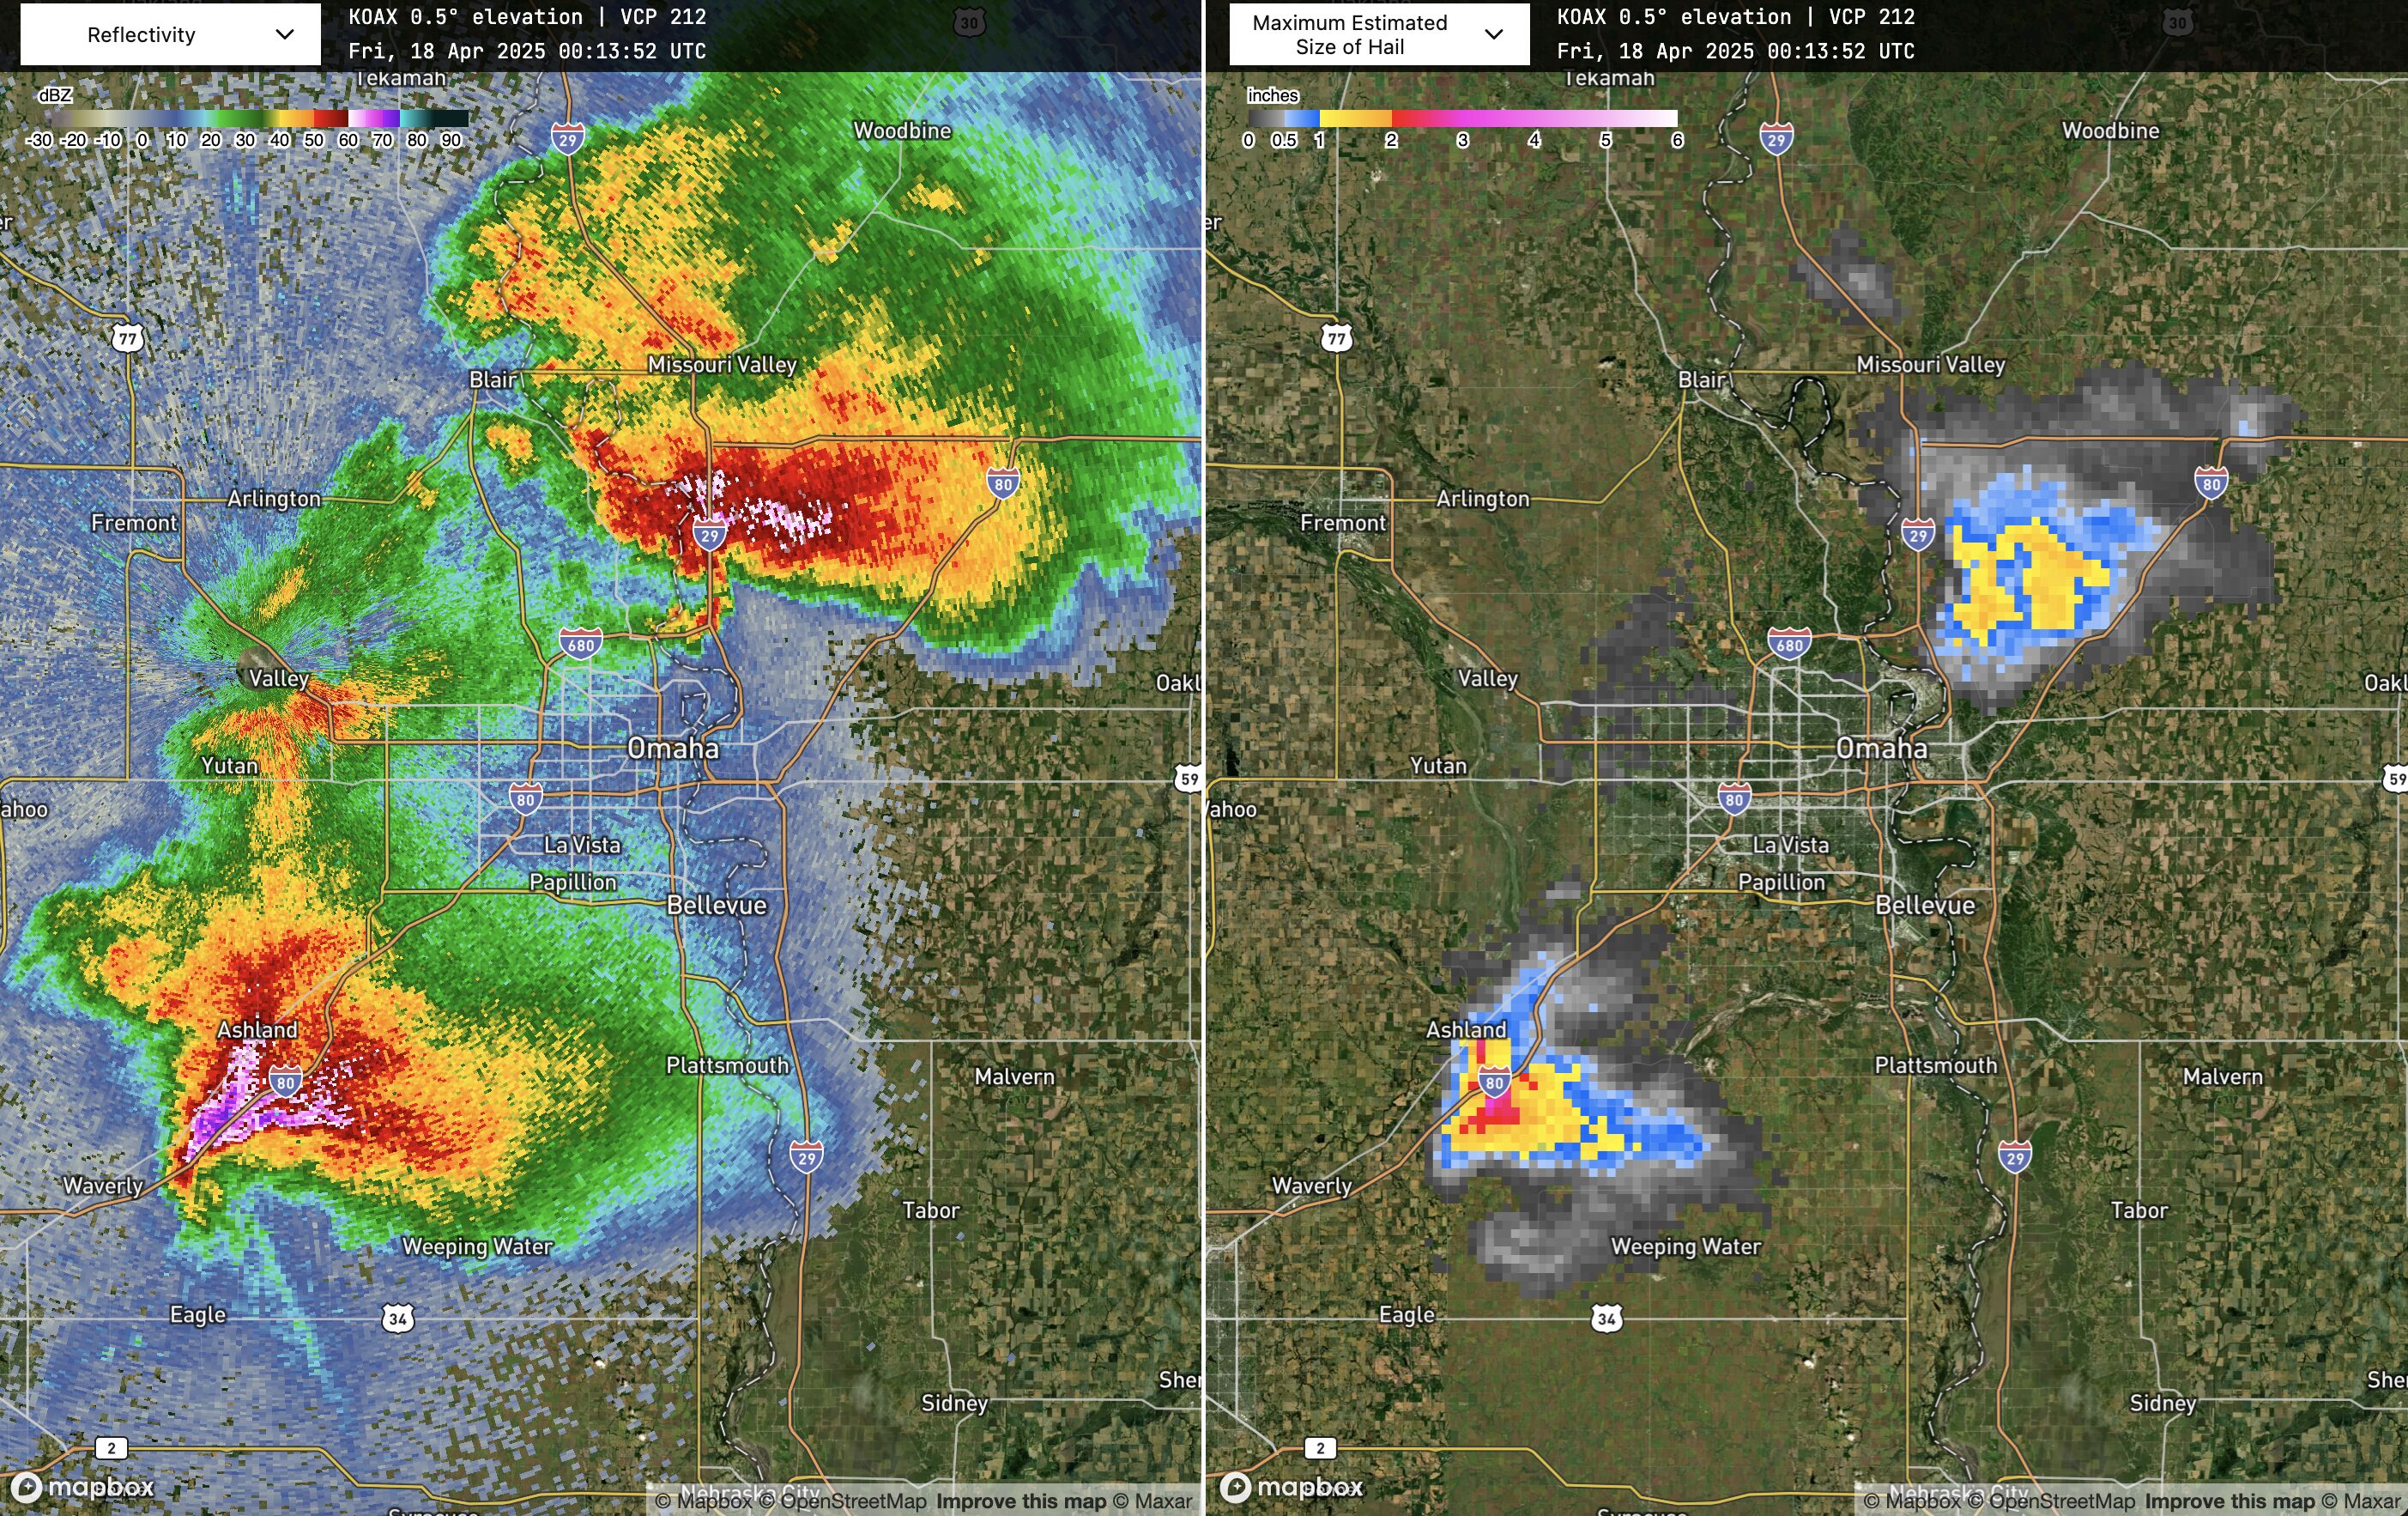
Maximum Estimated Size of Hail
Only QuadWeather Extra subscribers have access to hail algorithm output.
RAP model output is combined with all elevations of reflectivity to produce an estimate of hail size in inches following Witt et al. 1998. The equation was derived empirically, and its output indicates the 75th percentile of expected hail size given observed values of reflectivity and temperature through the column. In effect, this treatment means observed hail sizes will be smaller than the algorithm's output 75 percent of the time. It is a "worst case" field.
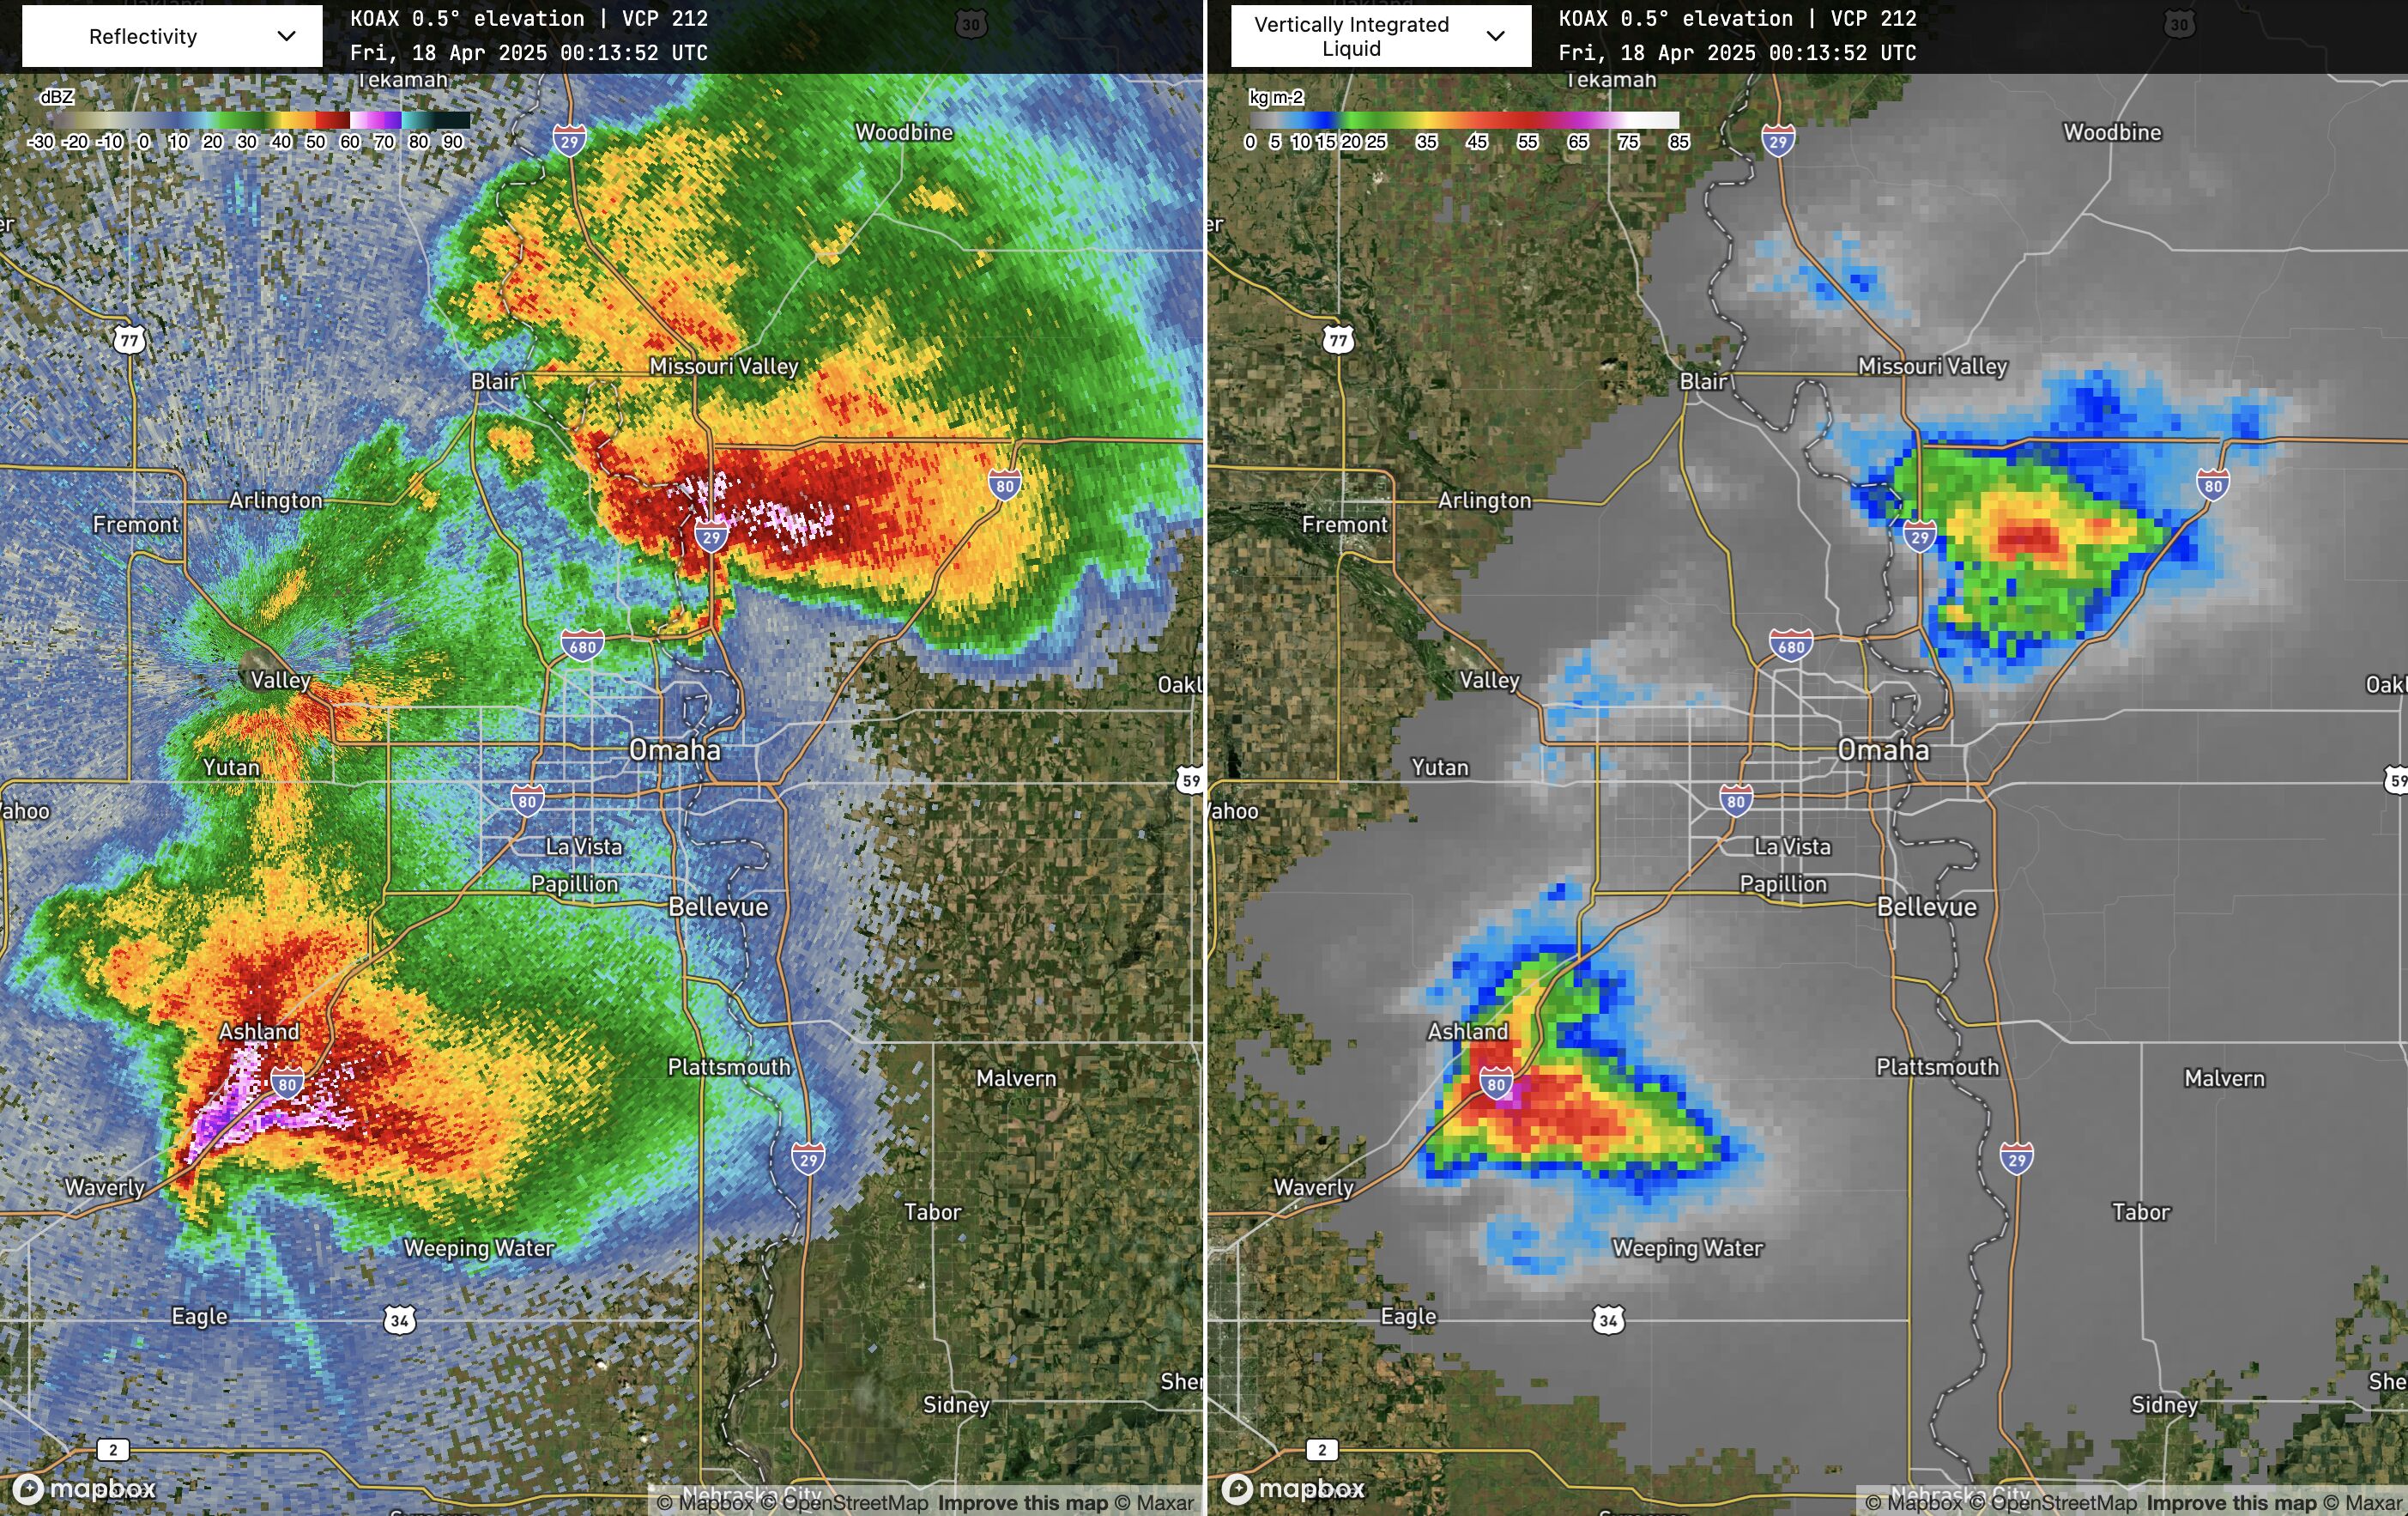
Vertically Integrated Liquid
Vertically Integrated Liquid (VIL) indicates the amount of liquid water through the depth of the column. It can be used to identify which storms are most intense when they may all look similar in the base scan. Higher values indicate greater likelihood of severity. More information can be found on VLAB.
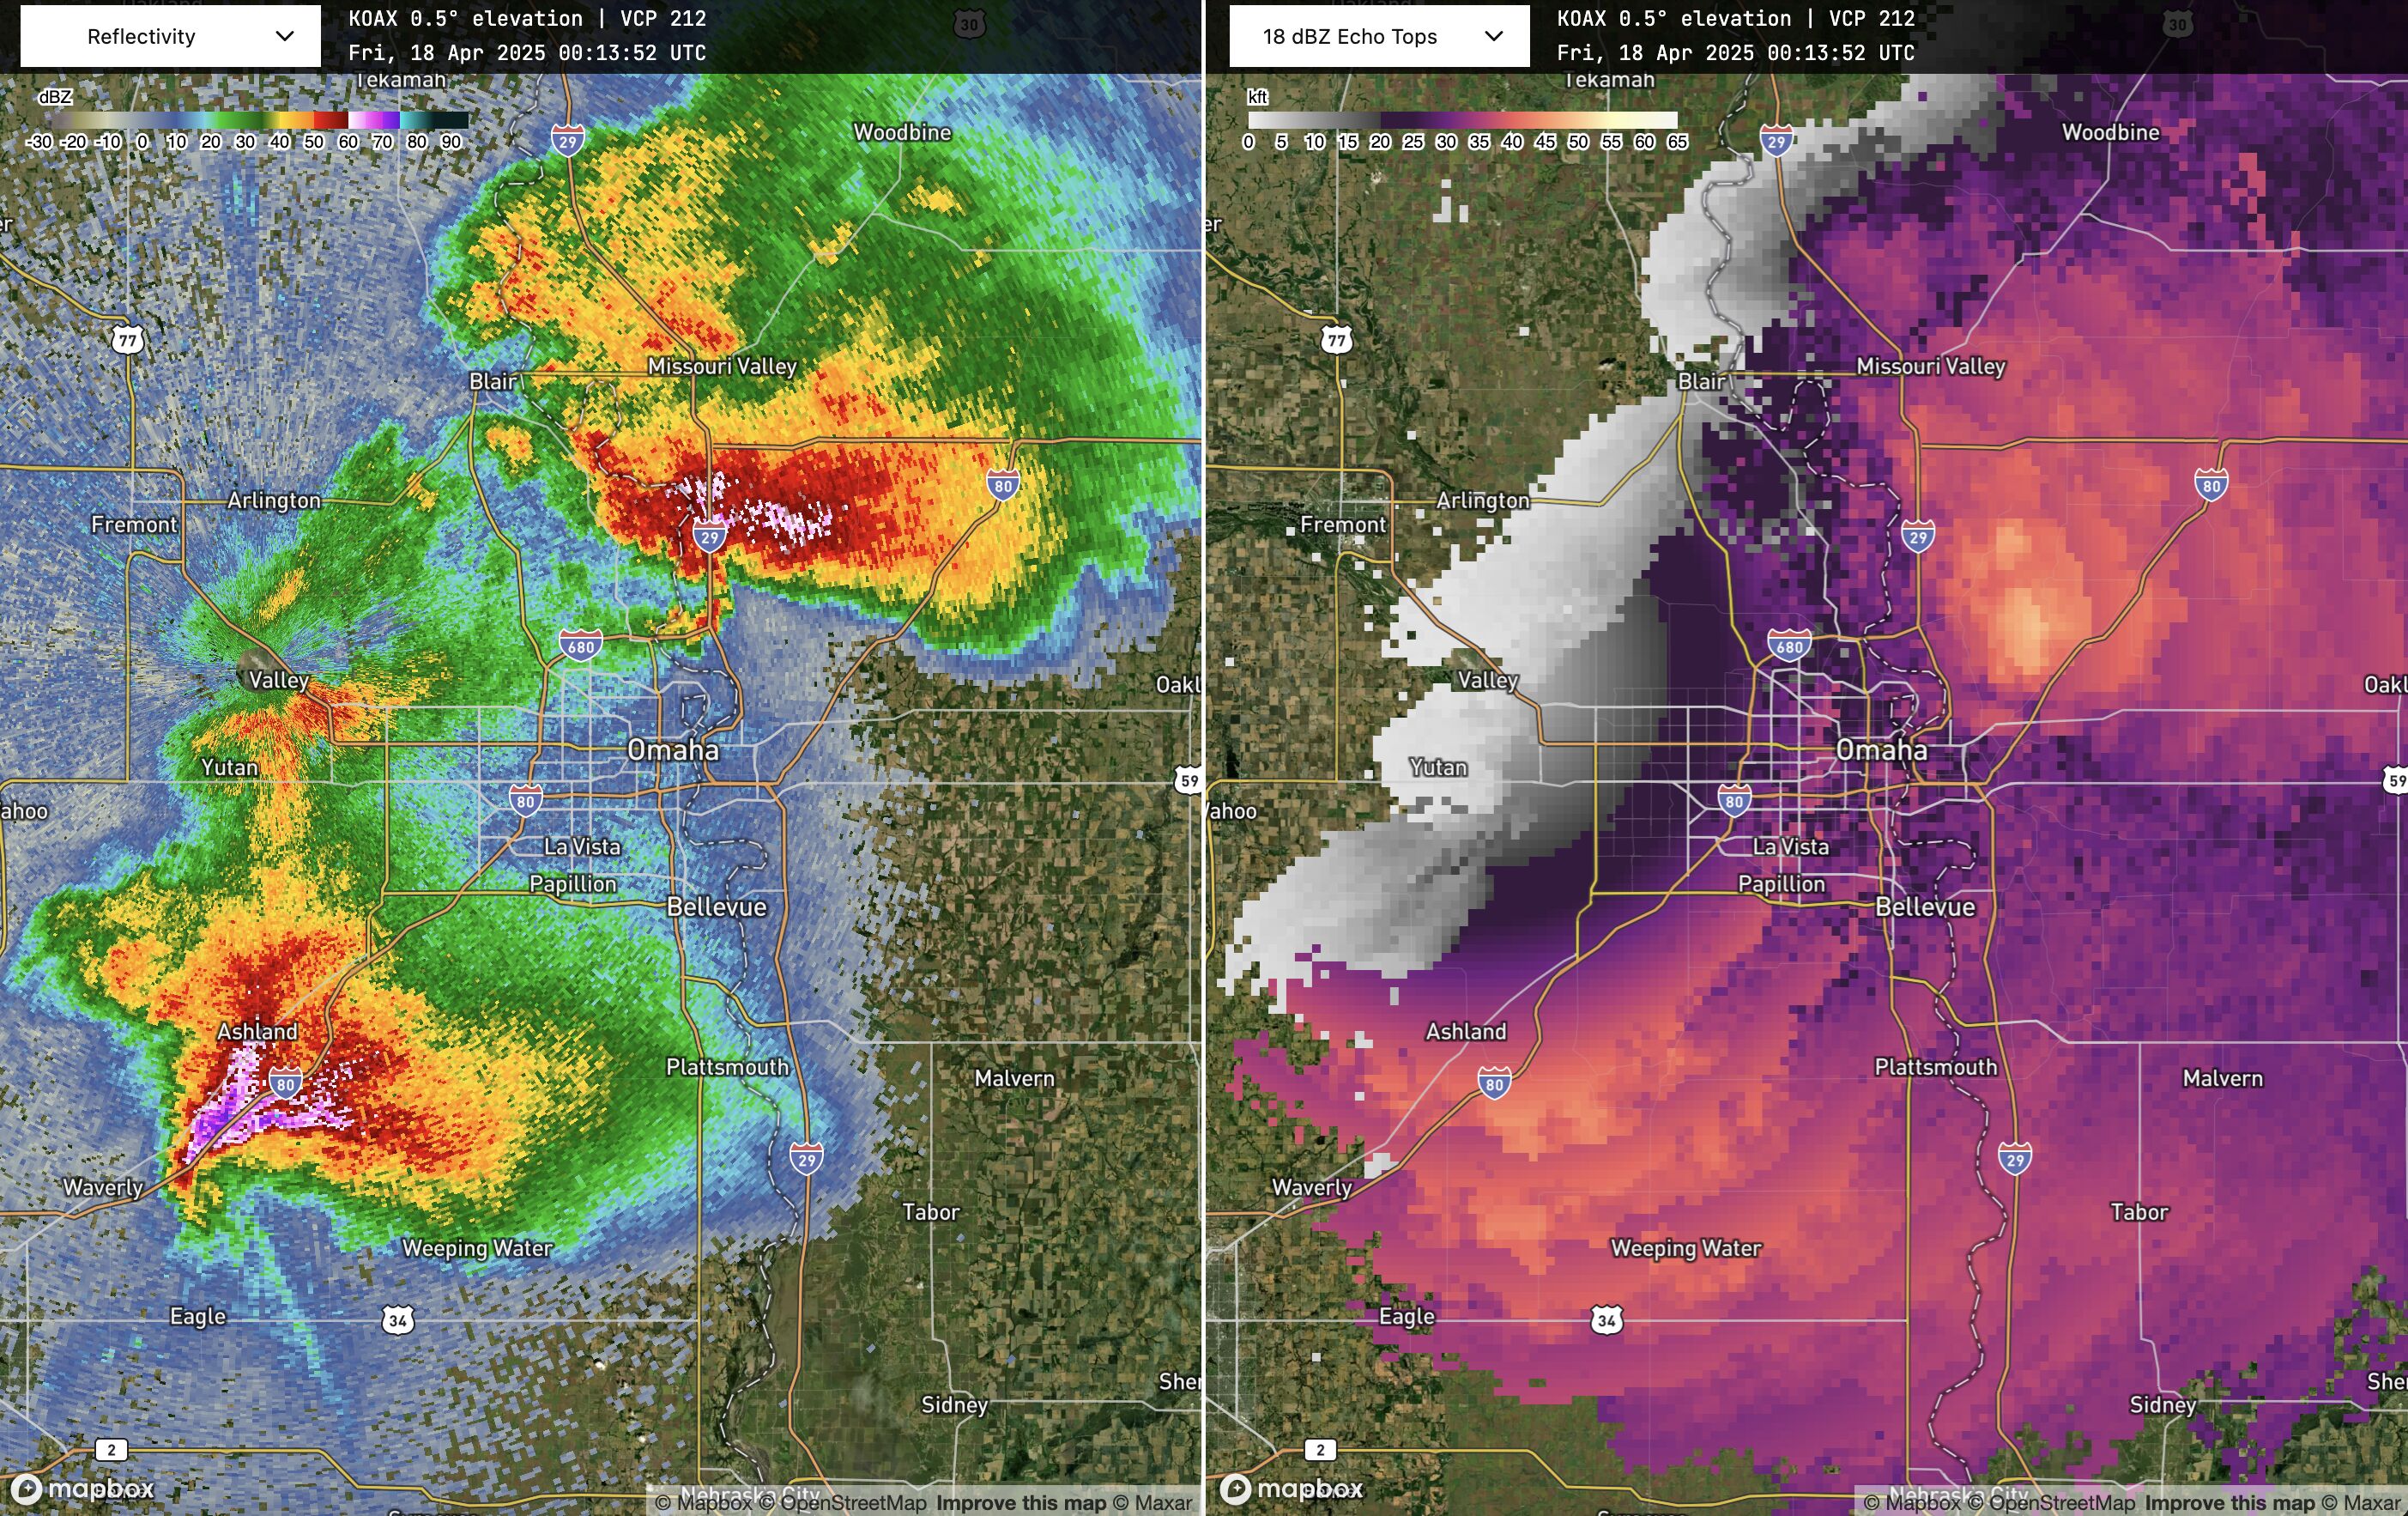
Echo Tops
The Echo Top field displays the calculated top of the storm in thousands of feet. The application's calculation uses a common reflectivity threshold of 18 dBZ. Echo Tops are useful in aviation contexts but also for general surveillance of strengthening and weakening updrafts. More information can be found on VLAB.